Building BI Pages
Configuration
For BI Pages to display relevant data, some transactions must have been posted for the data points being retrieved. For example, if a user is trying to view a BI Page on the past week's sales, there would need to be some Sales Orders created, shipped, invoiced, and/or paid.
Before a BI Page can be created and published, one or more BI Data Sets must be configured, which can be based on any published data including Combined Reports. If using Combined Reports in BI Data Sets and BI Pages, one or more Combined Reports must be added to a User's record via the "Published Data" button. Otherwise, no Combined Reports will be available to select from when creating the BI Data Sets. In addition, users will need to have the security setting "Toolbar -- publish BI Page" set to yes in order to create BI Data Sets.
Steps for BI Data Sets and BI Pages are included in the Process section below.
Note:
Process
Creating a BI Data Set
- Generate the desired report.
- On the DEACOM toolbar, click the "More" button, then select the "Publish Data" option.
- On the Publish Data form, select "BI Data Set" in the "Type" field, enter a description, and select the appropriate options in the "Start Data Type" and "End Data Type" fields.
- Click the "Save" button.
- The system will present a prompt asking if the user wants to add this BI Data Set to a BI Page.
- If "Yes" is selected:
- The Publish BI Data Set form will be displayed.
- Choose if the data set will be published to an existing or new BI Page by making the appropriate selection in the "Page Type" field.
- If publishing to a new BI Page, enter the page name in the "Name" field. If publishing to an existing BI Page, select the page in the "BI Page" field.
- Next, select "Grid" or "Graph" in the "Element" field.
- Click the "Continue" button to open the Edit BI Page form.
- If the "Graph" element was chosen, the Graph Data form will be displayed. If the "Grid" element was chosen, the Edit BI Grid form will be displayed.
- To edit and save a graph follow the steps beginning with the second bullet under step 7. in the Building BI Pages section below. To edit and save a grid, follow the steps beginning with the second bullet under step 8. in the Building BI pages section below.
- If "No" is selected:
- Click "Ok" on the prompt confirming the Data Set was saved and add the BI Data Set to a BI Page at a later time using the steps in the Building BI Pages section.
Managing BI Data Sets
To manage existing Datasets or to set a Combined Report as a Data Set, perform the following:
- Navigate to Tools > Maintenance > BI Data Sets.
- If modifying an existing BI Data Set, select the appropriate BI Data Set and click the "Modify" button to change the name or description of the BI Data Set as well as to make it inactive. Inactive BI Data Sets can be made active by first selecting the "Inactive" option via the "Display" button, selecting and modifying the appropriate BI Data Set and checking the "Active" flag before saving.
- If setting a Combined Report as a Data Set, click the "New" button to open the Edit BI Data Set form.
- Give the data set a Name and Description, if desired, and ensure the "Active" flag is checked.
- Select a Combined Report from those that the user has access to.
- Click "Save" then close the Edit BI Data Set form.
- Once a BI Data Set has been created or modified, users can run the BI Data Set by first selecting the BI Data Set and clicking the "Run" button on the BI Data Set form.
- Repeat steps 3-6 to continue creating data sets or close the BI Data Sets forms.
Building BI Pages
- Navigate to Tools > Management Reporting.
- Select a Report Type of BI Pages and click the "View" button.
- Click the "Add" button to open the Edit BI Page form.
- Give the page a Name and Description, if desired, and ensure the "Active" flag is checked.
- Click "Save" then "Edit BI page" to open the Edit BI Page form.
- Use the "Add", "Modify", and "Delete" buttons to manage the elements (graphs and grids) that will appear on the page.
- To add a Graph:
- Click "Add" then select "Graph" on the Select an Element to Add form to open the Graph Data form.
- Select the appropriate BI Data Set.
- If desired, select an appropriate BI page from the "Drill Down Page" field and a color profile from the "BI Color Profile" field. The "Drill Down Page" option allows users to create one BI Page that then drills into multiple BI pages instead of having all BI Pages displayed in the toolbar after publishing. The "BI Color Profile" option allows users to change the colors used in BI Graphs.
- Enter values in the fields on the "Size & Position" tab to determine the location and size of the element on the page. Alternatively, when viewing the BI Page, users can click and hold an element then drag and drop it to the desired location on the page and hover the mouse over the edge of the element to resize it. (Note:
- Example: Setting each field to 25 will position the element in the middle of the page, setting "Top" to 10 and the other fields to 25 will position the element centered, but further up towards the top of the page.
- Give the graph a title so that it can be easily distinguished from other elements that may appear on the page.
- Select the type of graph and how the calculation should be made, as well as how the data should be graphed and sorted, using the "Type", "Calculation" and "Calculated Field", "Graph By", and "Sort By" fields, respectively.
- If graphing by a date, select the appropriate values for "Date Grouping", "Financial Period Group", "Future Periods" and " Past Periods".
- To easily distinguish if the different data has reached a specific value, use the "Yellow Threshold" and "Red Threshold" fields, which will draw yellow and red lines on the graph at the values entered.
- Once all fields are set, click "Save" then close the Graph Data form.
- To add a Grid:
- Click "Add" then select "Grid" on the Select an Element to Add form to open the Edit BI Grid form.
- Give the grid a title so that it can be easily distinguished from other elements that may appear on the page.
- Select the appropriate BI Data Set.
- If desired, select an appropriate BI page from the "Drill Down Page" field. This option allows users to create one BI Page that then drills into multiple BI pages instead of having all BI Pages displayed in the toolbar after publishing.
- Enter values in the "Top", "Bottom", "Left", and "Right" fields to determine the location and size of the element on the page. Alternatively, when viewing the BI Page, users can click and hold an element then drag and drop it to the desired location on the page and hover the mouse over the edge of the element to resize it.
- Example: Setting each field to 25 will position the element in the middle of the page, setting "Top" to 10 and the other fields to 25 will position the element centered, but further up towards the top of the page.
- On the right hand side of the form, double click on the lines to change the visible value from yes to no or no to yes to determine if they should be included in or omitted from the grid.
- Once all fields are set, click "Save" then close the Edit BI Grid form.
- When all desired elements have been added to the page and positioned appropriately, click "Save" to save the page contents and layout then close the Edit BI Page form.
- When the page is ready to be published, use the "Publish - Users" button to publish the BI Page to one or more Users or the "Publish - User Groups" button to publish the BI Page to one or more User Groups.
- On the Publish form, use the Move and Remove buttons to select the desired records then click "Continue". The BI Page will be available for view by clicking the "Home" menu option on the DEACOM navigation menu.
Notes: 1. Advanced filters and sorts used when creating a BI Data Set will be applied when publishing BI grids. 2. Click the "Un-Publish" button and double click on a user in the list to un-publish them from a BI Page.
Navigating BI Pages
Some tips regarding viewing and analyzing the data contained in a BI Page include:
- Viewing details - Hovering the mouse over the data sections of a graph will display the label and value of the data.
- Drilling into the data - Double clicking on a section of data in a graph will drill down into the results. For example, if a user double clicks a specific bar in a graph the system will only display the data associated with the bar. If the user double clicks in the white space of the graph, the system will show all the data in the graph.
- Cross filtering - On a page with a graph and grid built on the same Data Set, clicking on a data section of the graph or date range on the X axis will filter the grid results to just the data pertaining to the selected data section/date.
- Reordering Pages - To reorder the available BI Pages tabs, click, drag, and drop a tab to the desired location.
- Refreshing data - Pages can be refreshed as often as desired using the "Refresh" button on the bottom right of the page.
BI Chart and Report Examples
Note:
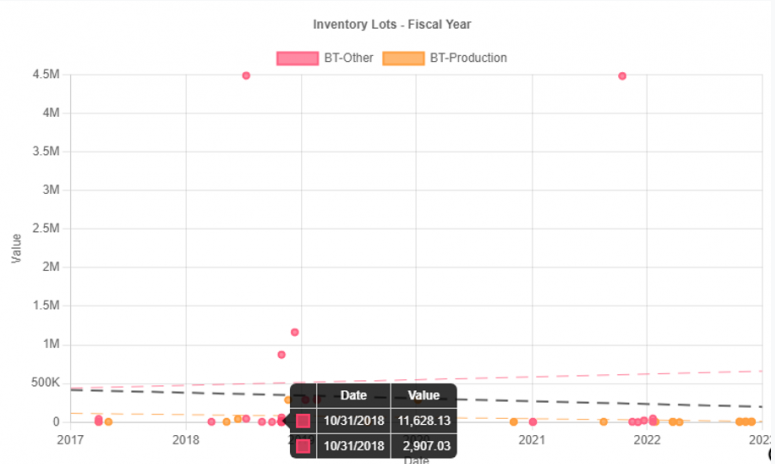
Scatter Chart - Inventory Lots (Fiscal Year)
The left two columns below indicate the information that is entered on the Graph Data Form Entries - Both "General" and "Size & Position" tabs (blank fields not included)
|
Field |
Value |
Chart Result |
|---|---|---|
|
BI Data Set |
Scatter Chart Examples |
Note the tooltip table is displayed when points are close together or share the same x-axis value. |
|
Graph Title |
Inventory Lots - Fiscal Year |
|
|
Type |
Scatter |
|
|
Calculated Field |
Value |
|
|
Graph By |
Date |
|
|
Date Grouping |
Fiscal Year |
|
|
Fiscal Year Group |
Default |
|
|
Past Periods |
6 |
|
|
Group On |
Location |
|
|
Trend Lines |
Dashed |
|
|
Width % |
43.0 |
|
|
Height % |
50.0 |
|
|
X-Anchor Reference |
Right |
|
|
X-Anchor Position % |
1.0 |
|
|
Y-Anchor Reference |
Bottom |
|
|
Y-Anchor Position % |
0.0 |
Bubble Chart - Quantity by Lot Cost
The left two columns below indicate the information that is entered on the Graph Data Form Entries - Both "General" and "Size & Position" tabs (blank fields not included)
|
Field |
Value |
Chart Result |
|---|---|---|
|
BI Data Set |
Bubble Chart Examples |

|
|
Graph Title |
Quantity by Lot Costs |
|
|
Type |
Bubble |
|
|
Calculation |
Sum |
|
|
Calculated Field |
Quantity |
|
|
Graph By |
Lot Cost |
|
|
Group On |
Location |
|
|
Width % |
48.0 |
|
|
Height % |
48.0 |
|
|
X-Anchor Reference |
Right |
|
|
X-Anchor Position % |
1.0 |
|
|
Y-Anchor Reference |
Bottom |
|
|
Y-Anchor Position % |
1.0 |
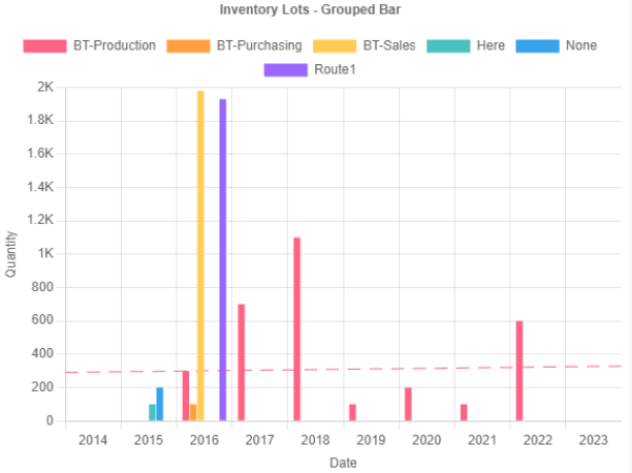
Grouped Bar - Inventory Lots
The left two columns below indicate the information that is entered on the Graph Data Form Entries - Both "General" and "Size & Position" tabs (blank fields not included)
Grouped bars display multiple series as separate bars, but repeatedly over different blocks such as years. They display data much like area charts, except for the following:
- The area chart values all fall on the same line.
- The grouped bar chart values are side-by-side.
|
Field |
Value |
Chart Result |
|---|---|---|
|
BI Data Set |
Grouped Bar Examples |
|
|
Graph Title |
Inventory Lots - Grouped Bar |
|
|
Type |
Bar - Grouped |
|
|
Calculation |
Sum |
|
|
Calculated Field |
Quantity |
|
|
Graph By |
Date |
|
|
Sort By |
Graph By Value |
|
|
Date Grouping |
Fiscal Year |
|
|
Fiscal Year Group |
Default |
|
|
Group On |
Location |
|
|
Trend Lines |
Dashed |
|
|
Width % |
32.0 |
|
|
Height % |
52.0 |
|
|
X-Anchor Reference |
Center |
|
|
Y-Anchor Reference |
Top |
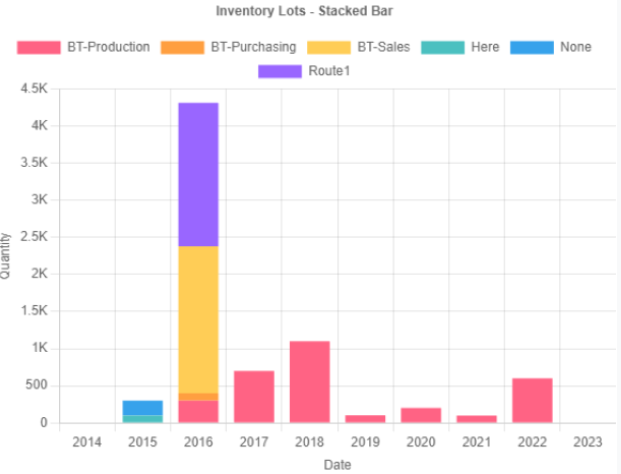
Stacked Bar - Inventory Lots
The left two columns below indicate the information that is entered on the Graph Data Form Entries - Both "General" and "Size & Position" tabs (blank fields not included)
Stacked bars include the values from multiple series in a single bar, assigning each series a differently colored section corresponding to its value. They display data much like a standard bar chat, except for the following:
- Standard bar charts show only the combined total of all series that contribute to the total.
- Stacked bar charts show a bar for each contributing series, such that their total
|
Field |
Value |
Chart Result |
|---|---|---|
|
BI Data Set |
Stacked Bar Examples |
|
|
Graph Title |
Inventory Lots - Stacked Bar |
|
|
Type |
Bar - Stacked |
|
|
Calculation |
Sum |
|
|
Calculated Field |
Quantity |
|
|
Graph By |
Date |
|
|
Sort By |
Graph By Value |
|
|
Date Grouping |
Fiscal Year |
|
|
Fiscal Year Group |
Default |
|
|
Group On |
Location |
|
|
Width % |
32.0 |
|
|
Height % |
52.0 |
|
|
X-Anchor Reference |
Right |
|
|
Y-Anchor Reference |
Top |
Funnel - Sales Contact Records Process
The left two columns below indicate the information that is entered on the Graph Data Form Entries - Both "General" and "Size & Position" tabs (blank fields not included)
- No legend series are shown.
- Series names appear as Y-ticks (left side).
- The topmost series will be the first stage, and holds the (largest) value that will be considered as 100%
- Stepping down from the top, each series represents the next stage, and should be less (or equal to) the one above it.
- Series percentages appear as Y-ticks (right side).
- The percentage is in relation to the initial value (topmost series).
- No X-axis values are shown.
- The actual series value is shown when the mouse is hovered over the series bar.
- For funnel charts that are sorted by value in the "Sort By" field, a "Total" series will be displayed that sums all values across every series. This could be record count, quotas, etc. The Total series will always represent the 100% max value. Each series value represents a percentage of the Total value, and it is important to note that higher series do not include lower series values. If the funnel chart is sorted by caption in the "Sort By" field, the system treats each later stage value as being included in earlier stages. No "Total" series will be added in this case, as it will be unnecessary.
|
Field |
Value |
Chart Result |
|---|---|---|
|
BI Data Set |
Contact Status |
|
|
Graph Title |
Contacts Records - Funnel |
|
|
Type |
Funnel |
|
|
Calculation |
Sum |
|
|
Calculated Field |
Record Count |
|
|
Graph By |
Contact Search 2 |
|
|
Sort By |
Calc Value / Descending |
|
|
Width % |
27.0 |
|
|
Height % |
48.0 |
|
|
X-Anchor Reference |
Left |
|
|
X-Anchor Position % |
16.0 |
|
|
Y-Anchor Reference |
Top |

Polar Area - Inventory Lots
The left two columns below indicate the information that is entered on the Graph Data Form Entries - Both "General" and "Size & Position" tabs (blank fields not included)
- Each series slice has the same angle.
- The radius of each slice represents the series' value relative to the total of all series values.
|
Field |
Value |
Chart Result |
|---|---|---|
| BI Data Set | Inventory Lots |

|
| Graph Title | Inventory Lots - Polar Area | |
| Type | Polar Area | |
| Calculation | Sum | |
| Calculated Field | Quantity | |
| Group On | Location | |
| Width % | 24.6 | |
| Height % | 48.0 | |
| X-Anchor Reference | Right | |
| X-Anchor Position % | 25.1 | |
| Y-Anchor Reference | Top |
Radar - Quarantined Inventory
The left two columns below indicate the information that is entered on the Graph Data Form Entries - Both "General" and "Size & Position" tabs (blank fields not included)
- The "x-ticks" are the radial spoke labels.
- The "y-ticks" are the radius scale values (similar to a polar area chart).
|
Field |
Value |
Chart Result |
|---|---|---|
| BI Data Set | Quarantined Inventory |

|
| Graph Title | Quarantined Inventory - Radar | |
| Type | Radar | |
| Calculation | Sum | |
| Calculated Field | Quantity | |
| Graph By | Location | |
| Group On | Facility | |
| Width % | 32.0 | |
| Height % | 75.0 | |
| X-Anchor Reference | Center | |
| Y-Anchor Reference | Center |
Tile, Tile-Area, Tile-Bar, Tile-Line - Various Examples
The title for these graphs is driven by the "Graph Title" field on the Graph Data form. The text/information for these graph types are driven by the "Tile Expression" field on this same form. The left column in the table below shows the text and/or expression added in the "Tile Expression" field. This field can include the following: Javascript, SQL, and Plain Text (placed in quotes).
|
Type |
Graph Title & Tile Expression & Action (if necessary) |
Chart/Tile Result |
|---|---|---|
| Tile | Graph Title: Javascript Expression . Tile Expression: "JS Test" |

|
| Tile | Graph Title: SQL: Active Parts (Level 50) Tile Expression: "pr_level = 50" | |
| Tile | Graph Title: Pure Text Tile Expression: "Testing" |
FAQ & Diagnostic Tips
I am getting an LSE when I attempt to modify an existing BI Data Set or BI Page that contains a Combined Report.
Ensure that you have permission to view and use the selected Combined Report. This can be verified by a System Administrator performing the following:
- Navigate to System > Maintenance > Users.
- Select the appropriate user then click "Modify" then "Published Data".
- The Combined Report used in the BI Data Set/BI Page must be displayed on the right-hand side of the mover form, which means that the user has permission to view the report.
Tip: BI grids incorporate the record count and sums information exactly like the "sums bars" of standard Deacom grids.
Tip: Within combined report pre-filters, for every date type field, there are three date fields that can be used as control sources:
- datename_start (When using the _start date, it is treated as anything greater than or equal to that date.)
- datename_end (When using the _end date, it is treated as anything less than or equal to that date.)
- datename_exact (When using the _exact date, it is treated as anything that equals that date.)
Tip: When editing a BI page, charts will not react to a cursor hover and can be double-clicked to display the Graph Data dialog.
Tip: When clicking on the first element of a pie/bar chart on a BI page, area charts with the same dataset will focus on that element.
TIP: